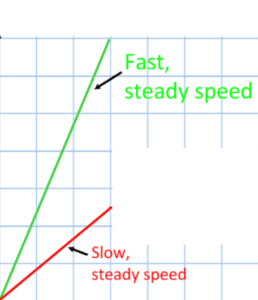
If you think about when we looked at speed, we looked at the graph on the left. We worked out that the purple line showed something that wasn’t moving (the car on bricks) and that the red line showed the fastest thing, this was the fighter jet. We know that the steeper the line the faster the object.
Journeys
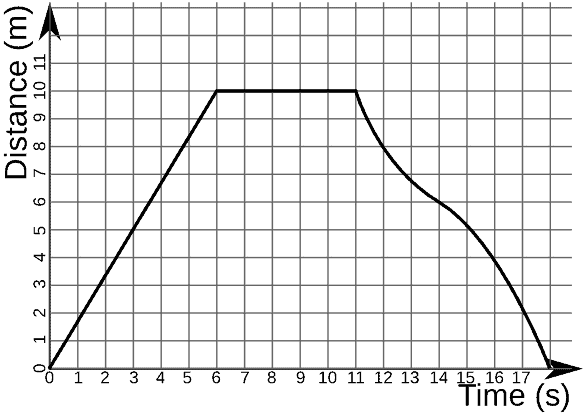
Distance time graphs can show a whole journey and we can work out information from that journey. In simple terms the graph on the right shows: – The first part was where they travelled away from where they started. – The second part they were stopped. – The third part shows that they returned back to where they started.
Remember that the steepness of the line shows the speed. The steeper the line the faster the speed. The steepness can be called the gradient. If the line isn’t straight then it means that the speed wasn’t steady, some parts were faster than others but they were still moving.
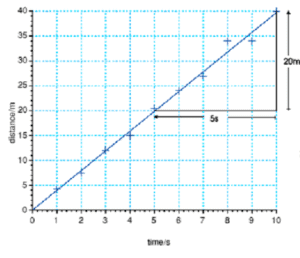
The gradient can be used to work out the speed for any part of the graph. You need to draw a triangle like the one above on the line. Then use the distance and the time in the equation speed = distance ÷ time.